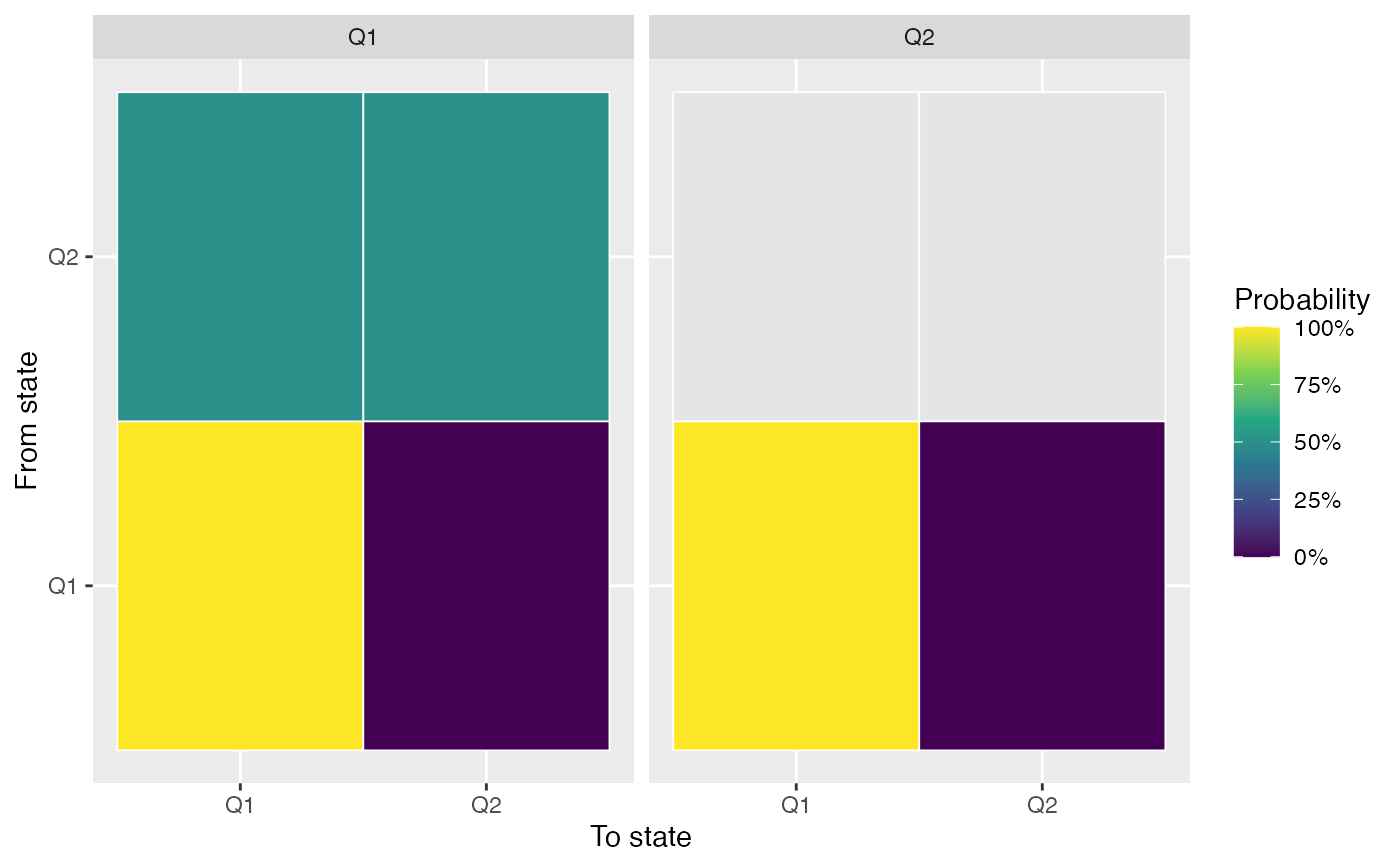
Plot Spatial Markov Matrices
Examples
panel <- data.frame(
  id = rep(1:4, each = 2),
  year = rep(2020:2021, times = 4),
  value = c(1, 2, 2, 3, 4, 3, 5, 6)
)
grid <- sf::st_sf(
  id = 1:4,
  geometry = sf::st_make_grid(
    sf::st_bbox(c(xmin = 0, ymin = 0, xmax = 2, ymax = 2)),
    n = c(2, 2)
  )
) |>
  dplyr::mutate(
    nb = sfdep::st_contiguity(geometry),
    wt = sfdep::st_weights(nb)
  )
spatial <- spatial_markov(panel, id, year, value, geometry = grid, k = 2)
plot_spatial_markov(spatial)