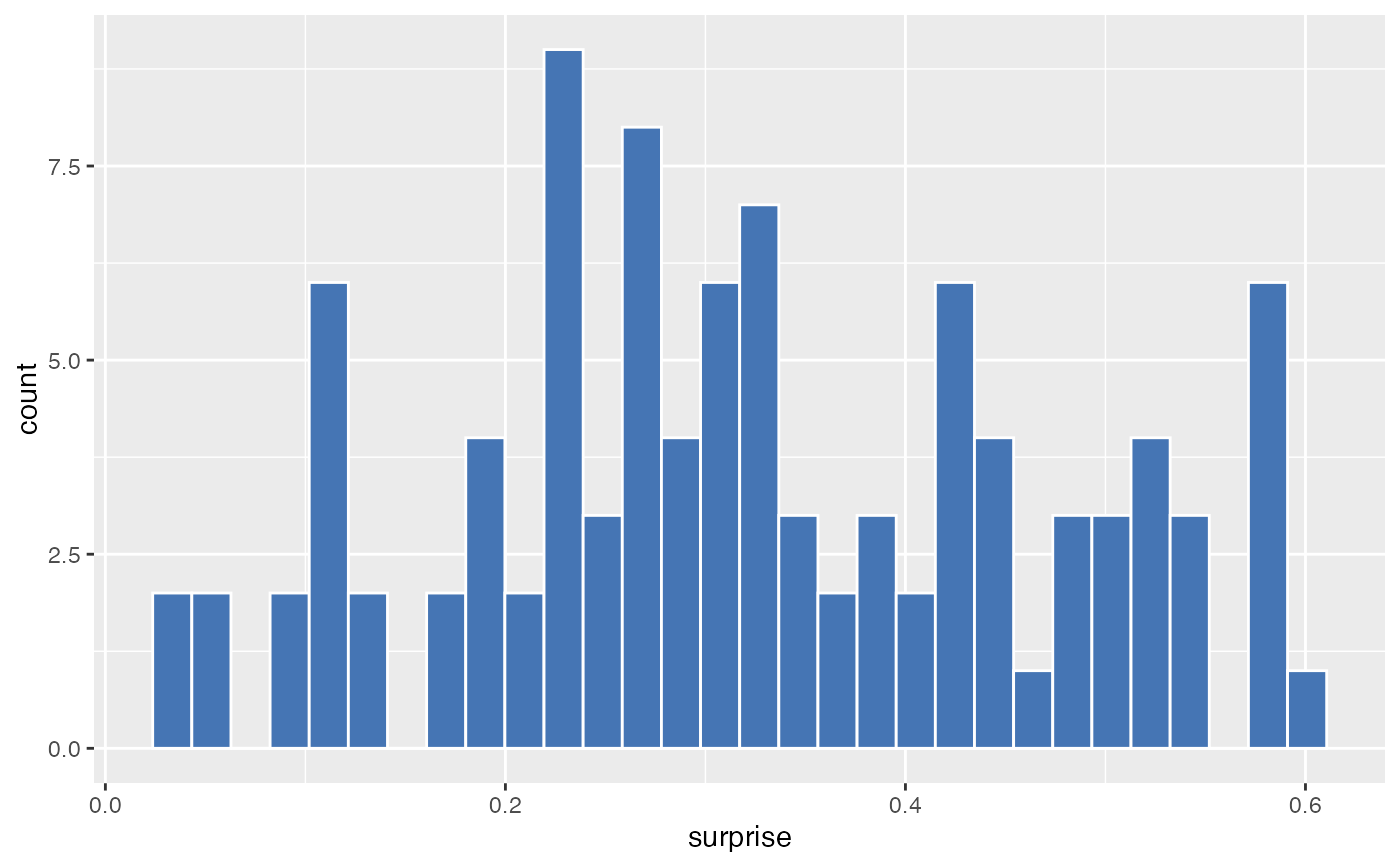
Creates a histogram of surprise values.
Usage
geom_surprise_histogram(
  mapping = NULL,
  data = NULL,
  which = c("surprise", "signed_surprise"),
  bins = 30,
  fill = "#4575b4",
  color = "white",
  ...
)
Arguments
- mapping
Aesthetic mapping
- data
Data with surprise values
- which
Which surprise to plot: "surprise" or "signed_surprise"
- bins
Number of bins
- fill
Fill color
- color
Border color
- ...
Additional arguments passed to
ggplot2::geom_histogram()