Signed Surprise Scale with Meaningful Thresholds
Source:R/ggplot2-scale.R
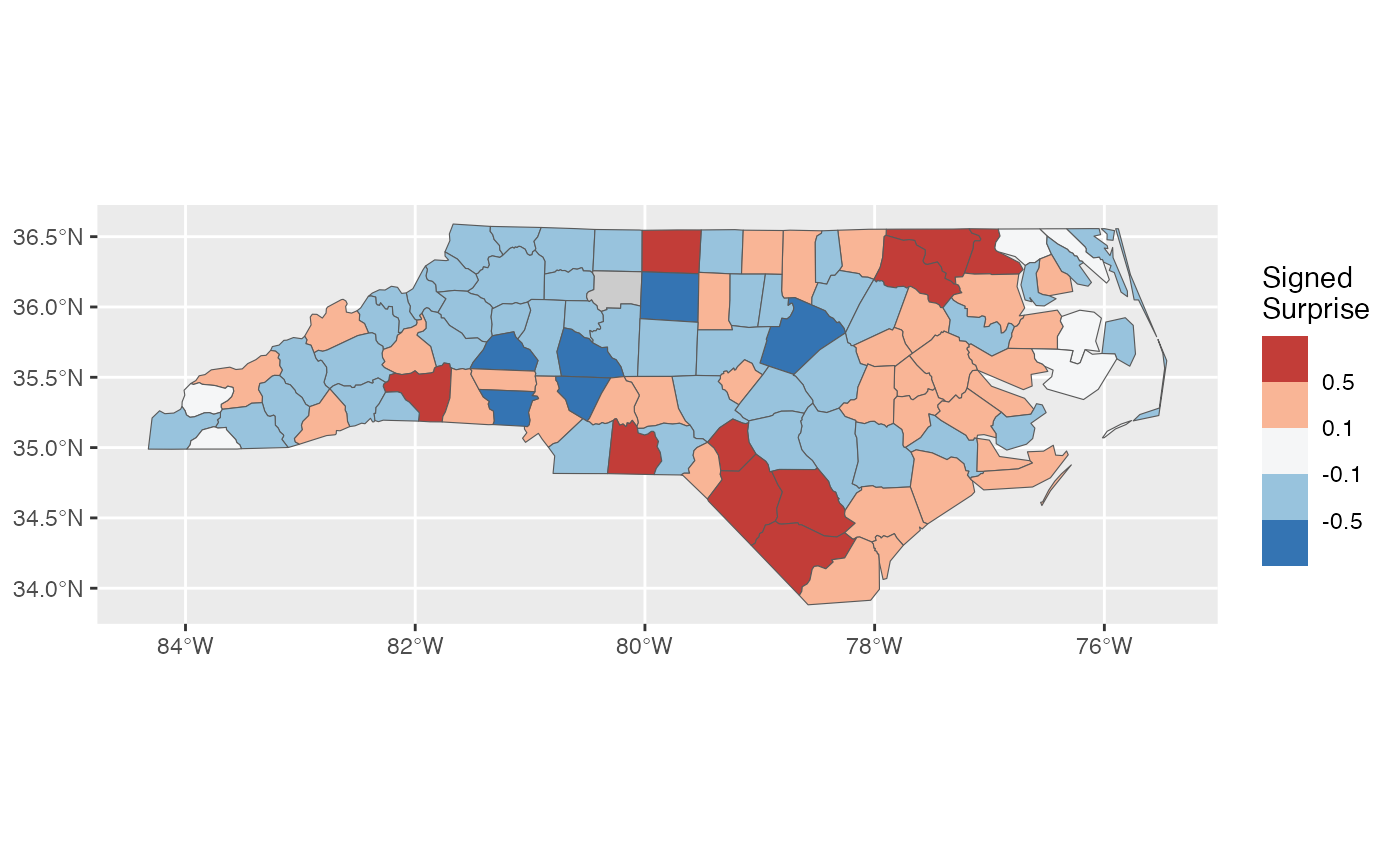
scale_fill_surprise_thresholds.RdDiverging color scale for signed surprise with breaks at meaningful thresholds based on the interpretation of surprise values.
Usage
scale_fill_surprise_thresholds(
  breaks = c(-1, -0.5, -0.1, 0.1, 0.5, 1),
  palette = "RdBu",
  direction = -1,
  name = "Signed\nSurprise",
  na.value = "grey80",
  ...
)

scale_colour_surprise_thresholds(
  breaks = c(-1, -0.5, -0.1, 0.1, 0.5, 1),
  palette = "RdBu",
  direction = -1,
  name = "Signed\nSurprise",
  na.value = "grey80",
  ...
)

scale_color_surprise_thresholds(
  breaks = c(-1, -0.5, -0.1, 0.1, 0.5, 1),
  palette = "RdBu",
  direction = -1,
  name = "Signed\nSurprise",
  na.value = "grey80",
  ...
)
Arguments
- breaks
Numeric vector of break points. Default uses meaningful thresholds: -1, -0.5, -0.1, 0.1, 0.5, 1 (symmetric around 0)
- palette
ColorBrewer diverging palette. Default "RdBu".
- direction
Palette direction. Default -1 (red = positive/higher).
- name
Legend title
- na.value
Color for NA values
- ...
Additional arguments passed to scale
Details
Meaningful thresholds for interpreting signed surprise:
|surprise| < 0.1: Trivial - essentially as expected|surprise| 0.1-0.5: Minor to moderate deviation|surprise| 0.5-1.0: Substantial - genuinely surprising|surprise| > 1.0: High - very surprising
Positive values indicate higher than expected; negative indicate lower.